
Examining users’ trust in AI for developing data visualization
Examining how designers with minimal coding experience trust ChatGPT to develop data visualizations in Observable, through the lenses of competence and reliability.
Project Overview
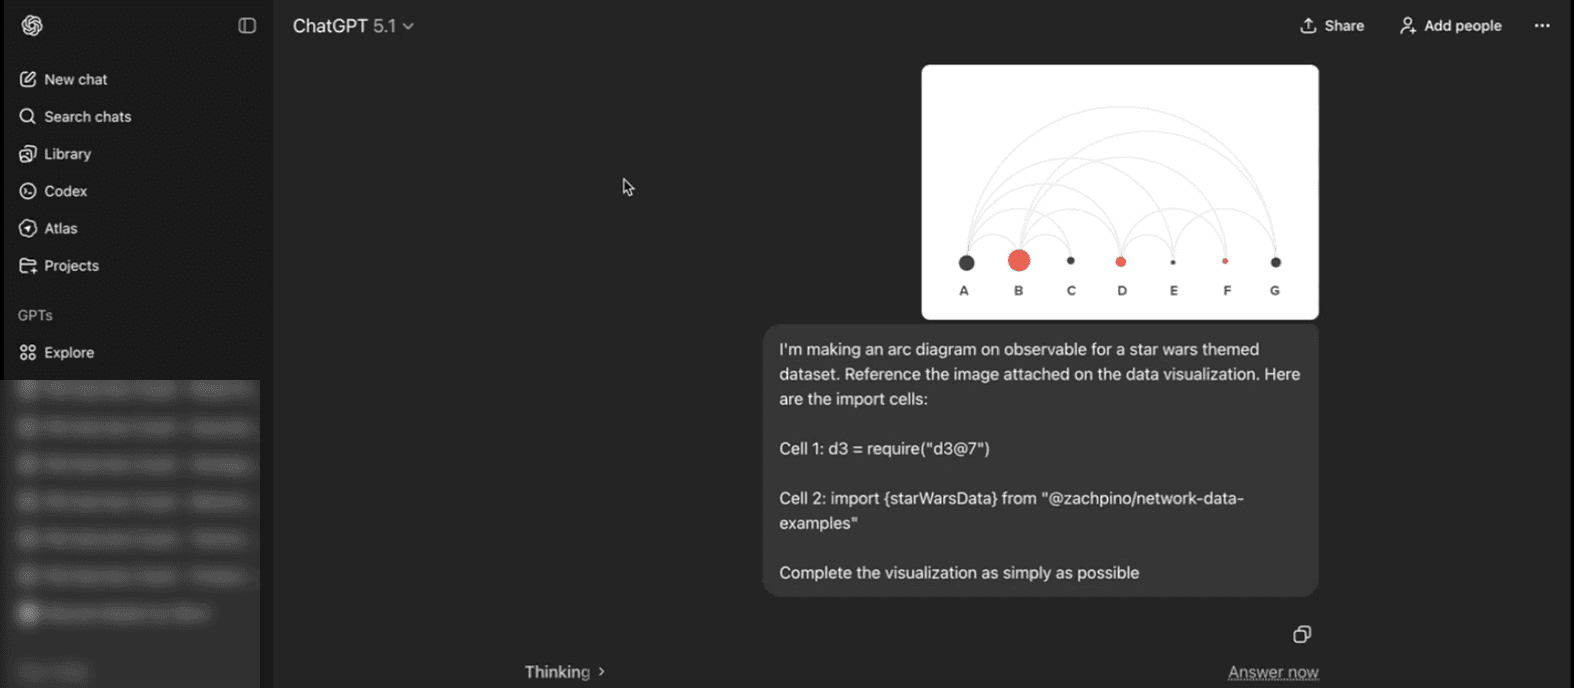
For designers with limited coding backgrounds who need to visualize large amounts of data, generative AI can assist by generating code for data visualization.
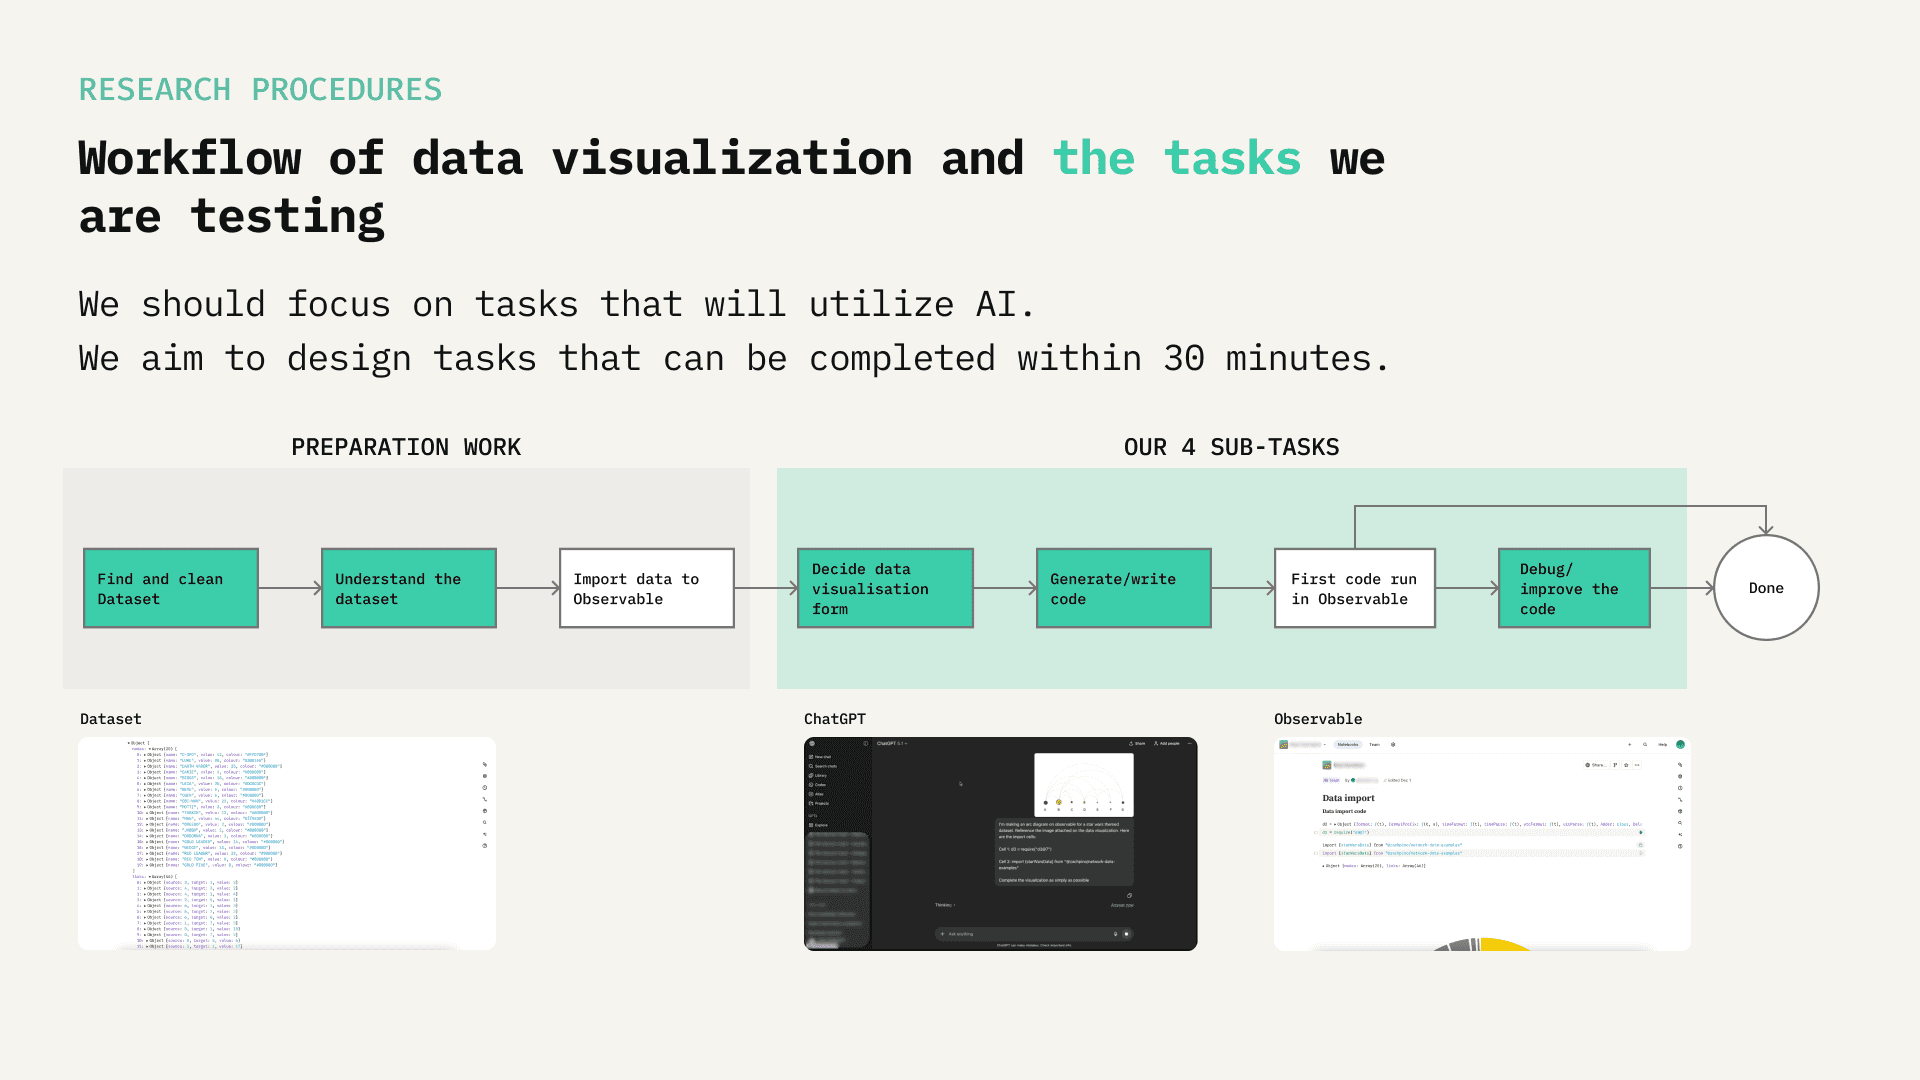
This two-week project explores designers’ trust in ChatGPT when generating and debugging code for data visualization in Observable through five 40-minute usability tests, focusing on perceptions of competence and reliability.
Key Research Questions
- How do designers use, or not use, ChatGPT to decide the optimal data visualization form? - How and why do designers trust generated code and debugging recommendations from ChatGPT for data visualization?
Project outcome
My Role
Design Researcher
The Team
Jiawei Zhang - design researcher
Brian Dexheimer - design researcher
industry
AI Tools
Data Visualization
Food & Beverage
Design attributes
Research Findings
Research Insights
Skills
Journey mapping · Usability testing · Behavioral analysis · Research synthesis ·
tools
Figjam, Figma, Microsoft Survey, Observable
timeline
Nov - Dec 2025 (2 weeks, part-time)
With a two-week timeline and a small sample,
this project was designed as an exploratory study
instead of one aimed at synthesizing general findings.
Project highlights


See the work in detail
Detailed project storytelling slides|2 weeks|3-5 mins to scan
Trust in AI for developing data visualization
These slides present a complete storytelling of this research project.